COVID-19 Lockdown and Online Surveys
 | |
| Short description | Response quality from online survey panels declined in 2020. |
| Data QualitySurvey Research | |
| American Association for Public Opinion Research | |
| 2022 |
TL;DR
The COVID-19 pandemic had a profound impact on numerous elements of academic and industry research, one of which is surveys. In this paper, we explore how the U.S. lockdown coincided with a decline in response quality of survey data collected from online panels. Poor quality survey data can reduce the reliability of our estimates and, ultimately, our assertions about what we know. To illustrate this, we analyze a multi-wave cross-sectional survey conducted on Amazon Mechanical Turk (MTurk), Lucid, and Prolific from November 2019 to June 2020. Our findings reveal a sharp decline in response quality during this time period. We emphasize the importance of using a variety of metrics to track response quality when using online panels.
Study Overview
| Wave | Date | Vendor | Participants | Compensation |
|---|---|---|---|---|
| 1 (Pilot) | Nov. 15, 2019 | MTurk, Lucid | 166 | $1.75 |
| 2 | Jan. 22-23, 2020 | MTurk, Lucid, Prolific | 598 | $2.00 |
| 3 | Feb. 4-5, 2020 | MTurk, Lucid, Prolific | 601 | $2.00 |
| 4 | Apr.16-17, 2020 | MTurk, Lucid, Prolific | 600 | $2.00 |
| 5 | May 20-21, 2020 | MTurk, Lucid, Prolific | 599 | $2.50 |
| 6 | Jun. 15-16, 2020 | MTurk, Lucid, Prolific | 600 | $2.50 |
The 10-minute survey contained questions on politics and current events as well as standard demographic measures. It also featured an experiment where participants read a vignette and provided their opinions thereafter. Although the experimental design was modified slightly between waves, the quality check items remained consistent.
The six quality checks included in the design were:
- Attention checks: Two: (1) The respondent was asked to select “Strongly disagree” for the third item in an agree-disagree grid; (2) The respondent was asked to respond to the statement “I have never used the internet” with True or False. The respondent received one flag for each attention check that they failed.
- Inconsistent responses: The respondent was asked their age (in years) at the beginning of the survey. They were then asked for their year of birth at the end of the survey. If the two answers were more than 2 years apart, the respondent received a flag.
- Open-ended answers: The open-ended question was: “What do you think is the most important issue facing the U.S. today?” Respondents received flags for non-response; “don’t know” or similar; irrelevant answer; gibberish or keyboard mashing; or copy-pasted text.
- Speeding: The respondent received a flag if they took less than ½ the median response time to complete the survey.
- Straightlining: The respondent received a flag if they chose the same response option in a question grid, despite some grid items being reverse-coded.
- Drop-offs: If the respondent exited the survey before the end or clicked through to the final page without responding to any questions, they received a flag for ‘incomplete.’
Study Findings
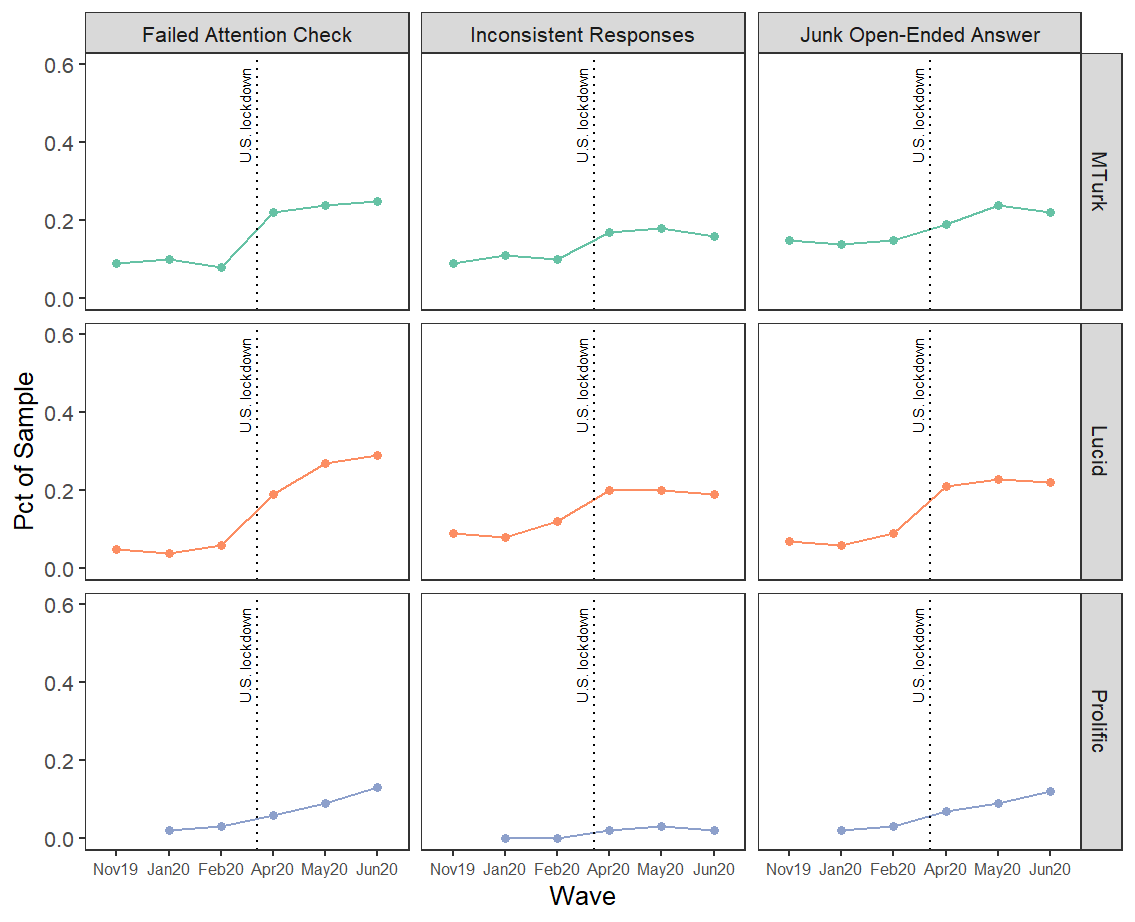
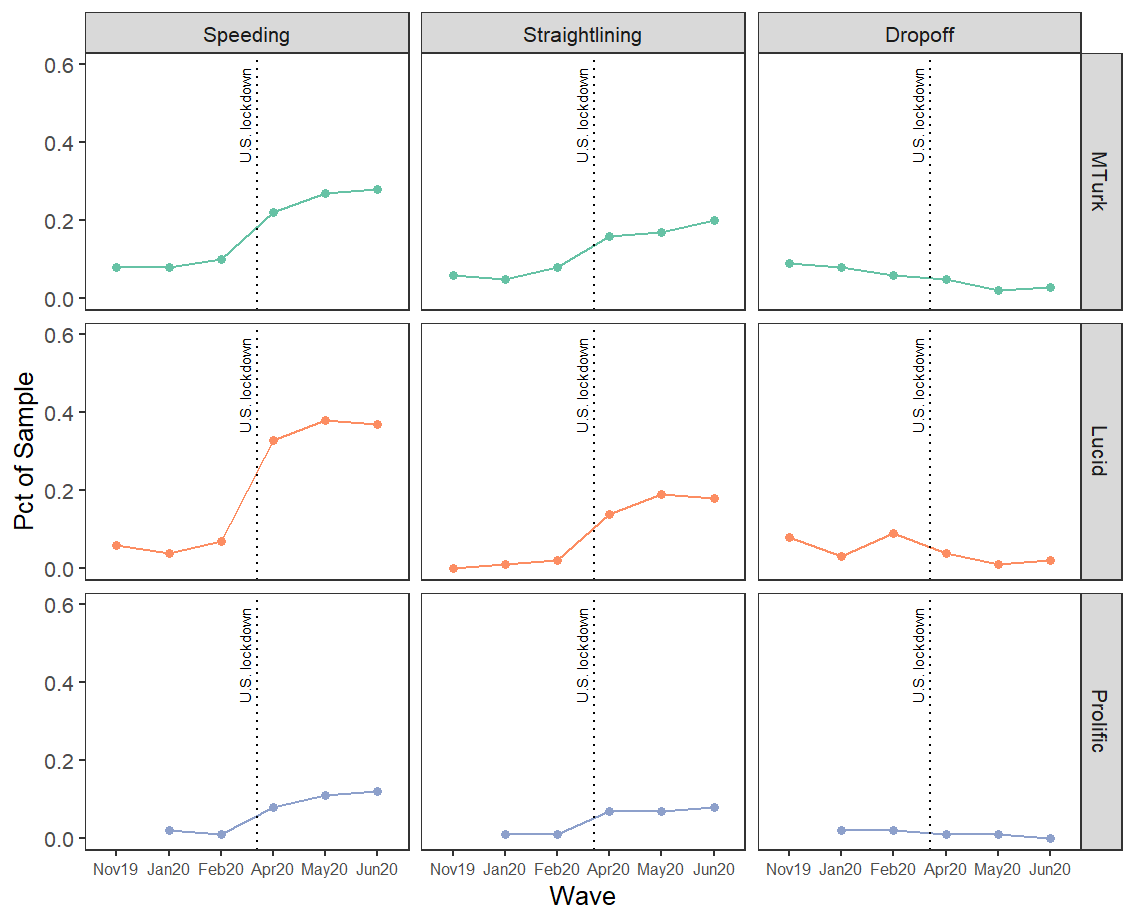
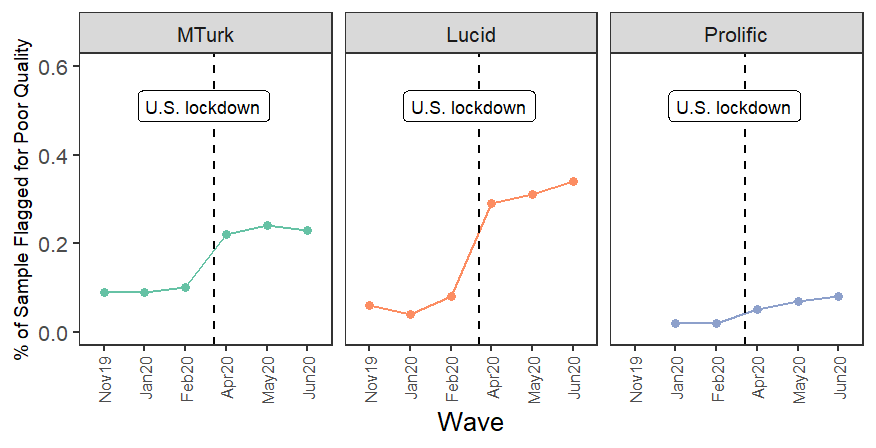
For all quality metrics, with the exception of drop-offs, a larger share of the panel sample were flagged following U.S. lockdown in mid-March of 2020. In May and June 2020, an average of 21-22% of the sample received two or more flags for response quality issues. This contrasts with an average of 5-6% of the sample in January and February that year. Response quality declined most noticeably for the Lucid panel, where more than a third were flagged in June 2020.
The figures below display the breakdown for each of the six quality metrics by online panel. Failing attention checks and speeding increased most after lockdown, especially for the Lucid sample. Prolific saw the least declines in response quality compared to Lucid and MTurk, but it was still significant. Unexpectedly, however, the proportion of drop-offs—respondents exiting the survey early—declined in the waves following lockdown.