Diagnosing Survey Response Quality
| Cover |  |
|---|---|
| Short description | Best practices for evaluating data quality issues in surveys. |
| Website | https://www.elgaronline.com/edcollchap/book/9781800379619/book-part-9781800379619-11.xml |
| Tags | Data QualitySurvey Research |
| For | Handbook on Politics and Public Opinion |
| Year | 2022 |
TL;DR
As non-probability samples become more commonplace in survey research, concerns about obtaining quality survey responses have increased tenfold. Issues of low-quality data or ‘satisficing’—arising from inattention, carelessness, or fraudulent behavior—pose significant threats to the reliability and validity of survey estimates. We emphasize the industry’s need for a systematic approach to diagnose and address response quality issues, and we explore the strengths and limitations of various metrics.
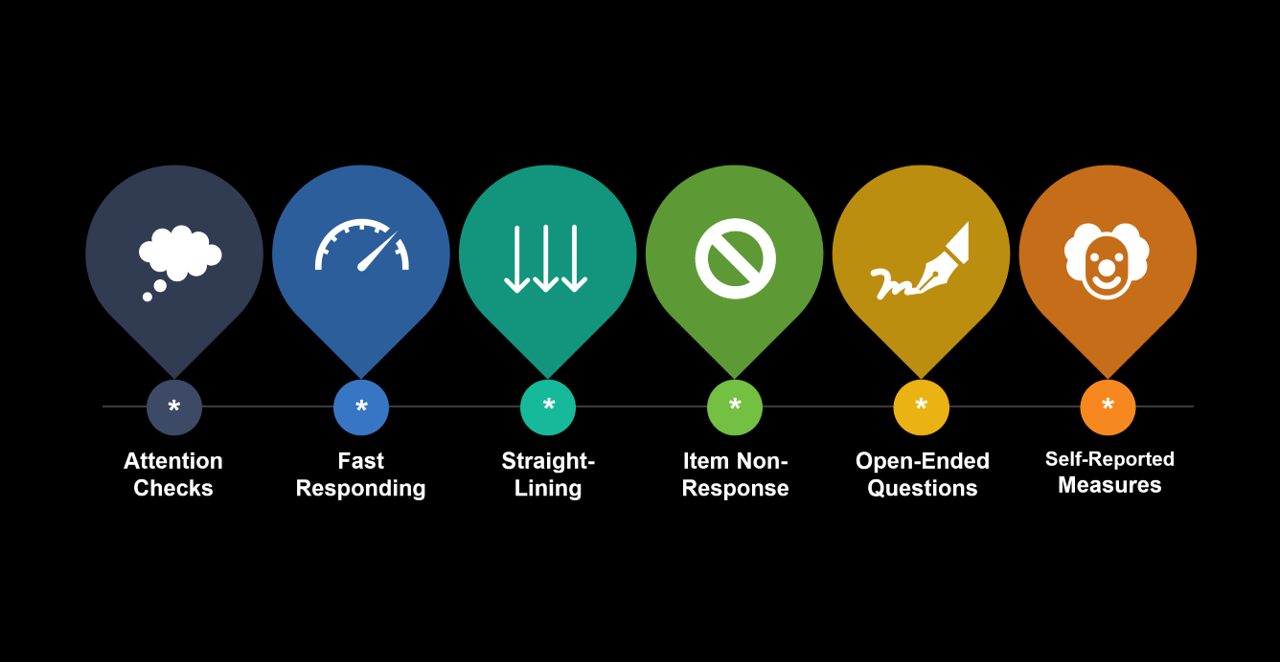
- Attention Checks: Researchers often deploy attention checks or “trap questions” to identify inattentive survey respondents. However, attention checks face challenges, as respondents may find them misleading, leading to survey break-offs or changes in behavior. Researchers are advised to use attention checks with caution, keeping them fair and simple while treating them as quality flags rather than a basis for exclusion, especially if placed deep in a survey.
- Speeding: Speeding, or fast responding, serves as a common metric for detecting low-quality data and satisficing. Rapid responses may indicate inattention, which compromises data accuracy. However, determining an appropriate response time threshold is challenging, as this may be influenced by factors like question complexity and respondent reading skills. We recommend a conservative approach to speeding, where only respondents with excessively fast response times (e.g., below ½ of the median) should be flagged.
- Straightlining: Straightlining is the act of consistently providing identical responses to items in a series, often when items appear in a grid or matrix format. While many practitioners use straightlining as an indicator of inattention, careful design is crucial. Valid straightlining exists in scales with items of the same valence, making it essential to include negatively-correlated items. To enhance the metric's effectiveness, it’s recommended to place reverse-coded items early in the grid and exclude a middle category (e.g., “neither agree nor disagree”).
- Item Non-Response: Item nonresponse, where respondents refrain from answering or answer “don’t know,” may indicate satisficing. But while it’s widely used as a metric of quality, it’s imperfect, influenced by question difficulty, wording, and sensitivity. Given these limitations, we recommend relying on other metrics to evaluate data quality.
- Open-Ended Questions: Open-ended questions require respondents to provide original answers in their own words. Low-effort or irrelevant responses may indicate respondent satisficing. Obvious indicators are one- or two-word answers, non sequitur answers, gibberish, or plagiarized text. When using open-ended questions as a metric of data quality, we recommend choosing questions that are easy to answer and easy to analyze.
- Self-Reported Measures: This is where respondents directly report their (in)attention or honesty when answering the survey. Despite being detectable as quality checks, research suggests they can have a positive impact on data validity. Notably, individuals who admit to providing humorous responses may differ from those flagged for inattention, offering another way for researchers to gain insight into data quality.
We emphasize proactive measures to address data quality in online nonprobability surveys. Researchers should prioritize survey design practices and incorporate response quality assessment into the study plan, including pre-registration. They should use multiple detection methods for identifying problematic respondents, avoiding reliance on a single metric. If exclusions are necessary, conservative criteria should be applied, and the effects of exclusion should be analyzed and reported. We must be transparent when assessing data quality and acknowledge the inevitability of errors. This is necessary to uphold scientific integrity and ensure the credibility of research findings.